
How to Read Crypto Charts for Profitable Trading
Understanding how to read cryptocurrency charts is essential for anyone aiming to trade profitably. Crypto markets are known for high volatility, and making informed decisions requires more than just gut feeling. With the right chart-reading skills, you can identify trends, spot opportunities, and minimize risk. Here’s a beginner-friendly guide to reading crypto charts effectively.
Understand the Basics of a Price Chart
A crypto price chart shows how a coin’s price changes over time. Most platforms use candlestick charts, which display the open, high, low, and close prices (OHLC) for a specific period. Each candlestick shows:
- Green candle (bullish): Price closed higher than it opened
- Red candle (bearish): Price closed lower than it opened
- Wicks: Thin lines above/below the candle body showing highest and lowest prices
You can switch the time frame (e.g., 1-minute, 1-hour, daily) depending on your trading style—short-term traders use smaller time frames, while long-term traders prefer daily or weekly charts.
Identify Trends and Patterns
Trends show the general direction of the market:
- Uptrend: Higher highs and higher lows
- Downtrend: Lower highs and lower lows
- Sideways/Range: Price moves between a support and resistance level
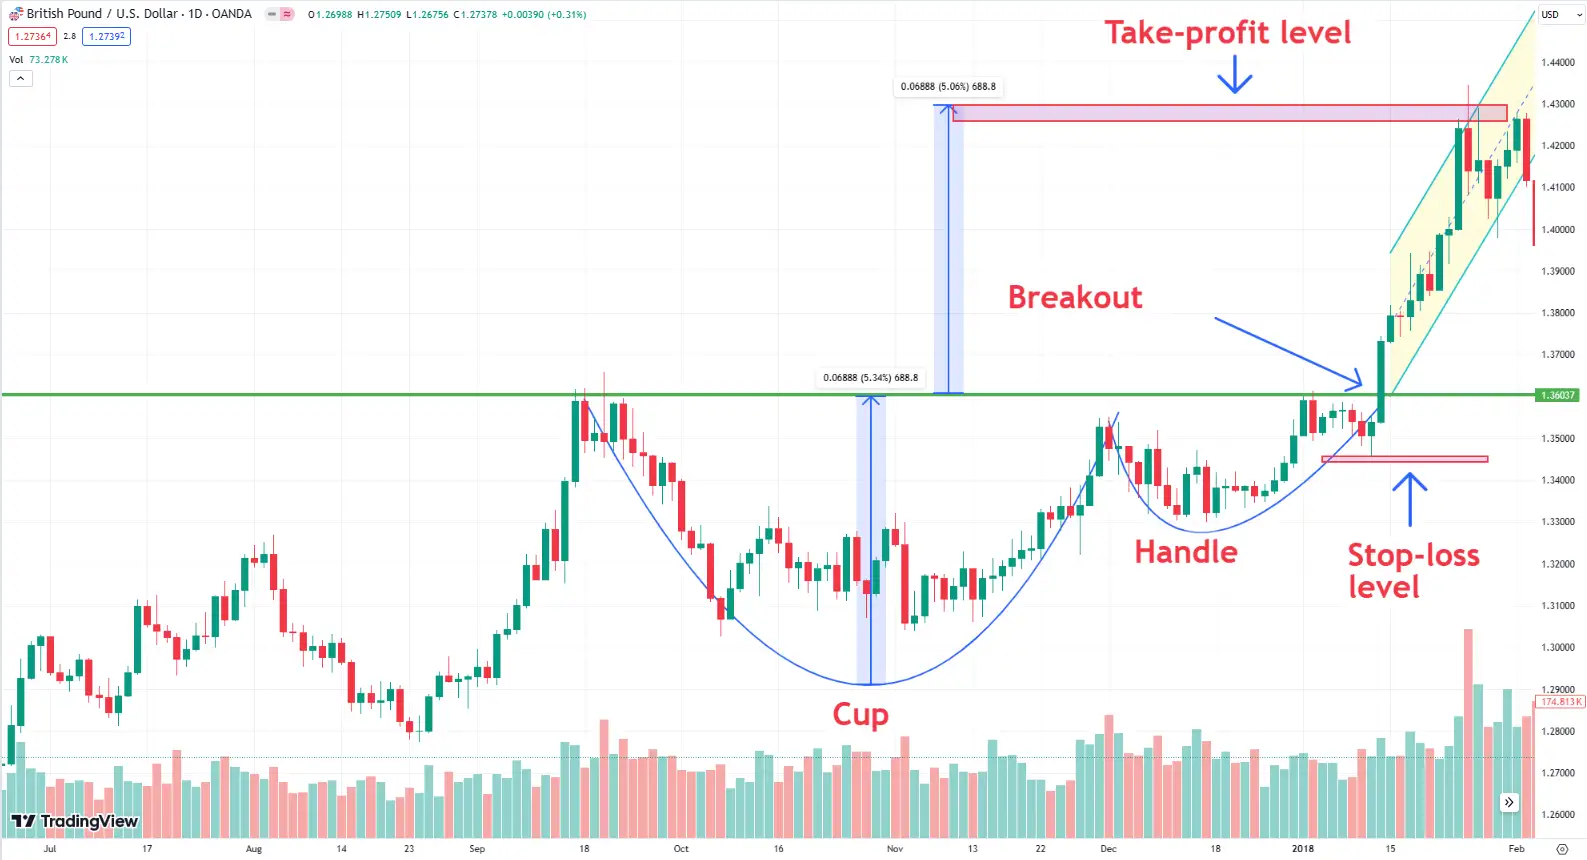
Patterns like head and shoulders, double tops/bottoms, and triangles can signal trend reversals or continuations. Recognizing these patterns helps you predict price movements more accurately.
Use Support and Resistance Levels
Support is a price level where buyers tend to enter, preventing the price from falling further. Resistance is where sellers appear, preventing further upward movement.
- Support = Floor
- Resistance = Ceiling
When a coin breaks above resistance or below support with high volume, it could indicate a strong new trend forming. These levels also help set entry and exit points.
Learn Technical Indicators
Technical indicators give extra insights into price momentum, strength, and potential reversals:
- Moving Averages (MA): Smooth out price action to identify trends
- Relative Strength Index (RSI): Shows overbought (>70) or oversold (<30) conditions
- MACD (Moving Average Convergence Divergence): Identifies momentum shifts
- Bollinger Bands: Measure volatility and potential breakout zones
Combining these indicators helps confirm trade setups and avoid false signals.
Volume Matters
Volume shows how many coins were traded during a given time. High volume confirms the strength of a trend or breakout, while low volume could indicate a lack of conviction.
- High volume + price move = strong signal
- Low volume + price move = weak or false breakout
Volume spikes often precede big moves, so watch volume closely when reading charts.
Conclusion
Reading crypto charts for profitable trading takes practice, patience, and continuous learning. By mastering candlesticks, spotting trends, using support/resistance zones, applying indicators, and analyzing volume, you’ll improve your timing and confidence. Chart reading doesn’t guarantee profits—but it dramatically increases your edge in the volatile world of crypto trading.